How to Use Bullish and Bearish Harami Candles to Find Trend Reversals
Show More
Quickly grasp the article's content and gauge market sentiment in just 30 seconds!
The Harami candle is a Japanese candlestick formation that can signal trend reversals, offering crypto traders a good risk-to-reward ratio trade setup. The pattern is created with two candles, a very tall candle followed by a substantially shorter candle.
Harami patterns can be found in any time frame. The process of trading them is fairly straightforward once you’re comfortable identifying them.
What Is the Harami Candlestick Pattern?
The Harami candlestick formation is a reversal pattern consisting of two candles. The first is a tall candle continuing a trend, and the second candle is significantly shorter, of an opposite color, signaling a reversal of the trend. The first candle’s body must completely engulf the second candle’s body.

The Harami is a Japanese candlestick pattern that is extremely popular among crypto traders. It’s easy to spot and gives traders a relatively tight risk range. As a result, the Harami pattern tends to yield a good risk-to-reward ratio when trading it.
“Harami” is a Japanese word meaning “pregnant.” That image makes it easier to grasp what the Harami chart pattern suggests. Just like a pregnant woman giving birth to a new baby, the Harami pattern gives birth to a new trend. Some analysts might say the shape of the pattern resembles a pregnant woman, too.
There are two types of Harami patterns: bullish and bearish.
Interpreting the Bearish Harami Candlestick Pattern
A bearish Harami occurs at the top of an uptrend. The pattern starts with a large, bullish green candle, followed by a smaller bearish or red candle.

A key component to the bearish Harami pattern is that the second candle must gap lower, in order to signal the prior uptrend has weakened. Within the crypto market, trading is continuous — 24 hours per day, 7 days per week. Therefore, it’s sporadic to see a gap up or down in crypto.
Knowing this, look for the second bearish candle to open — and then immediately sell-off. The body of the first candle needs to engulf the body of the second one completely. This is key to the Harami pattern, as prices are so weak that they can’t revert to a bullish momentum to the previous high, signaling uncertainty and a potential trend change.
Interpreting the Bullish Harami Candlestick Pattern
The bullish Harami candle pattern is the opposite of the bearish Harami and is found at the end of a downtrend. The first candle of the pattern is a large, bearish (red) candle. Then, prices gap higher on the next candle, substantially smaller and bullish green candle.

Within cryptocurrency markets, there likely isn’t going to be a gap higher. As a result, the bullish move will occur immediately after the close of the first candle. It’s important for the body of the second candle, the bullish green candle, to be completely engulfed by the body of the first red candle.
The bullish Harami hints that the trend is shifting from down to up.
What Does a Harami Candle Look Like?
The Harami is a two candlestick pattern. The first candlestick is quite tall in size. The second candlestick is substantially smaller. The body of the second candle must be contained or engulfed within the body of the first candle. Ideally, you want to see the second candle at less than half the size of the first candle.
This is where the image of a pregnant woman makes sense: she would be the first (tall) candle, and her baby is the second smaller candle embodied within the first.
An important distinction is where the second candle needs to gap on the open in the opposite direction of the first candle. Within crypto, gaps are rare, so that the patterns will look slightly different.
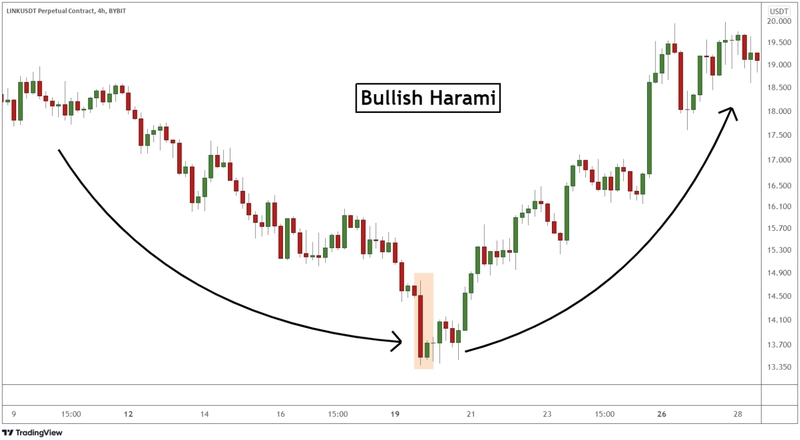
For example, above we see a bullish Harami develop on the 4-hour chart for LINK. In this chart, LINK is in a downtrend that corrects lower by about 30%. Then, a larger-than-normal bearish candle forms, followed by a small green candle. These two candles together create the bullish Harami. At that point, a new uptrend kicks off and LINK rallies over 40%
Identifying Bullish and Bearish Harami on a Trading Chart
Now that you’re familiar with the shape and structure of the Harami, it’s critically important to understand where you’ll find this pattern within the cryptocurrency market.

Bullish Harami patterns are the kickoff to new bull trends, just as we see in the Ethereum chart, above. Therefore, you only find them after a downtrend. After a series of lower highs and lower lows, the bullish Harami pattern starts with another big, bearish candle. This suggests the downtrend has accelerated and is possibly capitulating.
As the candle exhausts, a quick rally begins but stalls. In essence, the sellers are depleted, but the buyers haven’t shown up yet. This carves the second candle of the pattern, which is smaller and is encompassed by the body of the first candle.
The pattern is confirmed when the market continues to rally while holding above the recent low.
The opposite is true for a bearish Harami formation.

The bearish Harami is the kickoff to a new bear trend. Thus, it is seen only at the end of an uptrend. As the trend rallies higher, such as in the XRPUSD chart above, the Harami starts with a large green candle, which is visible as a blow-off to a mature trend. Unable to extend any further, the price begins to fall as the second candle’s high holds below the close of the first candle.
No significant progress is made to the downside, and the second candle’s body is engulfed by that of the first candle. This price behavior suggests the market is so weak that it cannot rally back to new highs.
Absent new buyers, the price falls further, beginning a new downtrend.
Harami Cross vs. Doji Candle
Some Japanese candlestick patterns have similarities and may be difficult to distinguish from one another. For example, the Harami Cross candle is a specific type of Harami pattern. It has some similarities to the doji pattern, but there are some differences in using the two.
First of all, the Harami Cross is a combination of the Harami pattern and a star doji.

The second candle of the Harami Cross is a star doji that looks like a plus sign. The same principle applies: the plus sign must be engulfed within the body of the first candle.
The doji candlestick pattern has some similarities to the Harami Cross. The most obvious similarity is that a star doji is one of the five different types of doji patterns. A specific type of doji is being inserted into the second candle of the Harami Cross.
However, the doji pattern is a one-candlestick pattern, while the Harami Cross is a two-candle pattern. The doji by itself is trendless. The doji pattern implies indecision, and we aren’t certain what the next trend will be.
On the other hand, the Harami Cross is at the forefront of a trend reversal. So coupling the star doji with the large candlestick of the Harami yields a specific pattern that suggests the trend is about to reverse.
How to Trade with the Harami Candlestick
Some benefits of trading the Harami pattern include the powerful signals it generates. These patterns are easy to spot, which can yield strong risk-to-reward opportunities. Below you’ll find a step-by-step process to identify and trade both types of Harami patterns.
Trading with Bullish Harami Candle
During the first part of 2021, Bitcoin was on a tear to the upside. There were periods of brief dips, which merely provided consolidation zones to launch the next rally.
One consolidation zone ended with a bullish Harami pattern. Let’s inspect this setup more closely.

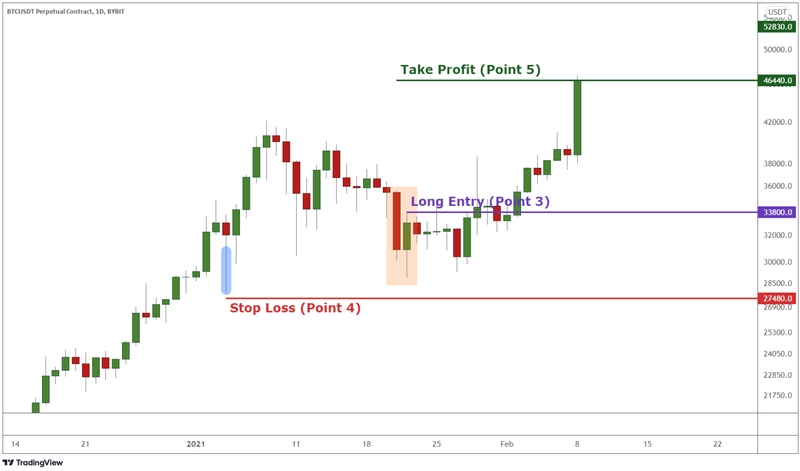
In January 2021, Bitcoin started to consolidate its recent gains and was trending lower in a correction. A downtrend is the first step in creating an environment ripe for a bullish Harami (1).
January 21, the largest down day for Bitcoin, suggests that traders may be capitulating and a bottom may soon form. This large red candle becomes the first of the two candles in the Harami pattern (2).
Sure enough, the next day sees Bitcoin mildly pressing lower, but ending the day at a higher price. The body of this second candle is engulfed by the body of the first candle (3). This helps set up the bullish trading opportunity.

The trade setup is straightforward. The long entry will take place just above the second candle high. In this case, the long entry will occur near $33,800 (3).
The stop loss should be set just below the Harami low point. In this case, there was a recent swing low just below this same price zone. Therefore, it would be prudent to set the stop loss just below all of those low points near $27,480 (4).
Then, we calculate the distance between the entry point and the stop loss. In this case, the difference is $6,320. We want to double that distance and it becomes $12,640.
Add the new doubled amount to the entry price to calculate a take profit level. $33,800 + $12,640 yields a take profit level of $46,440 (5).
This ensures a 1:2 risk-to-reward ratio.
After a couple of candles, the long trade entry into Bitcoin is triggered. Then, the trader waits for the target or the stop loss to be hit. Prices come close but never hit the stop loss level, and eventually rally to reach the target.
Trading with the Bearish Harami
Using Bitcoin’s daily chart as an example, in March 2021, the biggest cryptocurrency was rallying to new all-time highs. This rally had become quite strong and extended. In the chart below, symptoms of a top begin to emerge when a large green candle shoots up. This green candle will need to be larger than most other candles on the chart at that time.

Bitcoin is in rally mode, and in a clear uptrend (I). As the rally stretches to new highs on 13 March, as represented by the long green candlestick (first candle of Harami) indicating the buying pressure is strong in the recent trend.
The opening of the next candle begins a downward correction that stops about halfway through the first candle. This red bearish candle becomes the second candle of the Harami pattern (III).
.png?auto=webp&format=pjpg&width=800)
Now, the trader waits for the low of the second candle to be broken to signal a bearish entry into the position (IV). The stop loss is placed just above the Harami pattern high (V). The target is at least twice the distance from the entry to the stop loss (VI).
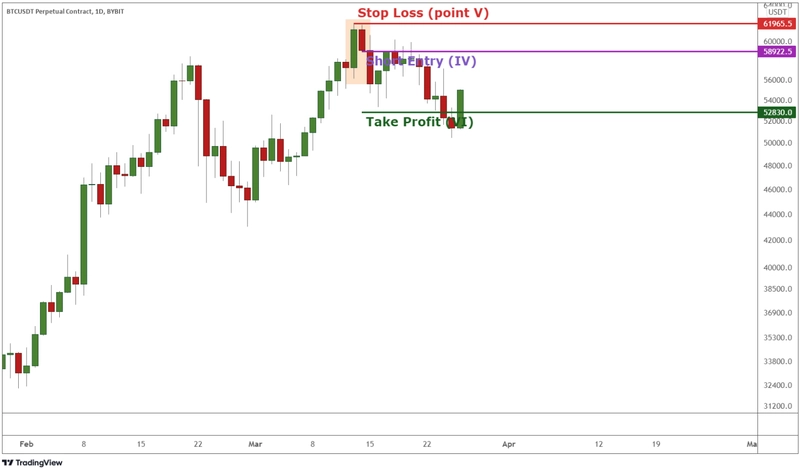
Bitcoin’s price reaches the target within a couple of weeks without being stopped out. This is a good example that illustrates how the pattern can generate a tight risk range, with good risk-to-reward trades.
Does Using the Harami Pattern Guarantee Its Accuracy?
Keep in mind that not all trades will work out to your benefit. It’s unreasonable to expect all of your trades to be profitable. The same logic can be applied to the Harami pattern.
Even though the Harami pattern is easy to spot, and can generate winning trades with a good risk-to-reward ratio, that doesn’t mean that each trade will be a guaranteed winner. This is why we suggest using a 1:2 risk-to-reward ratio on the trading plans above.
This way, you can be right less than half of the time but still allow yourself an opportunity to grow your account since your winning trades are larger than your losing trades.
The Bottom Line
Cryptocurrency traders commonly follow Harami candlestick patterns. The Harami pattern is found frequently within crypto markets and the process of trading it is straightforward.
Traders enjoy the tight risk range and good reward potential that the Harami pattern offers. However, like any other technical analysis tool, the pattern isn’t guaranteed to create winning trades. For the best results, it’s important to look for the Harami pattern within the context of the correct trend and to combine its use with other trading tools.
Candlestick Patterns Professional Traders Use
Best candlestick patterns – A curated list of candlestick patterns most frequently used by traders
How To Read Candlesticks Crypto – Learn the basics of candlestick patterns
Crypto Chart Patterns (Chart basics: trend, neckline, wedges)
Doji Candlestick – Basic candlestick unit
Bullish candlestick patterns
- Inverted Hammer Candlestick
- Bullish Engulfing Candlestick
- Cup and Handle Patterns
- Morning Star Pattern
- Three White Soldiers Pattern
- Triple Top Pattern and Triple Bottom Pattern
- Falling Wedge Pattern
- Dragonfly Doji Candlestick
Bearish candlestick patterns
- Bear Flag Patterns
- Gravestone Doji Candlestick
- Head and Shoulders Pattern
- Dark Cloud Cover Pattern
- Shooting Star Candlestick
- Rising Wedge Pattern
- Hanging Man Candlestick
- Bear Pennant Pattern
- Evening Star Pattern
- Triple Top Pattern and Triple Bottom Pattern
Other candlestick patterns
- Hammer Candlestick – Has both bullish and bearish candlestick
- Double Top and Double Bottom – Has both bullish and bearish candlestick
- Spinning Top Candle – Has both bullish and bearish candlestick
- Marubozu Candlestick Pattern – Has both bullish and bearish candlestick
- Tweezer Bottom Pattern – Has both bullish and bearish candlestick
- Continuation Patterns – Determining a continuing trend
Grab Up to 5,000 USDT in Rewards
Get additional 50 USDT welcome gift instantly when you sign up today.